Impact of our work.
The measure of a project is the impact it has had on other people and their practices. Our partnership has worked tirelessly to disseminate the work of our project and this can be evidenced through a wide range of impacts, both qualitative and quantitative.
Quantitative Impact Data
As of March 1st 2023...
Our combined social media presence alone has a following of approximately 44,292 people and analytics of all the posts via twitter, LinkedIn, facebook and other social media platforms show highly positive feedback with through likes or qualitative comments. For example tweets are routinely reposted or liked and comments often left
Our Global Education Network has grown since its launch in 2021 to 159 people with a weekly average of 73 unique visits per week. The most viewed post has had 162 views since it was posted in January 2022, has had 6 likes and had one positive comment.
Our website has also had google analytics enabled. It shows that since it went live in February 2022, we have had 3,809 unique visits, averaging 293 unique views per month. Our most viewed page being the scoping study followed by the teacher CPD page.
In addition to the 44,292 people reached through our social media and the 3,809 people reached through our website, we have counted a further 43,373 present at other workshops, conference presentations, within our own local and regional networks including those who have signed up to our newsletter.
|
For 2022, we received the ‘Most cited journal article” for the following publication: Parmigiani, D., Jones, S.L., Kunnari, I. & Nicchia, E. (2022). Global competence and teacher education programmes. A European perspective. Cogent Education, 9(1). https://doi.org/10.1080/2331186X.2021.2022996 having been viewed 3,650 times. Whilst it is true that some of these people might be double counted (e.g. the same person might have visited our website who has signed up to our newsletter), the numbers being impacted by our work as they access it via various channels is still likely to be high. |
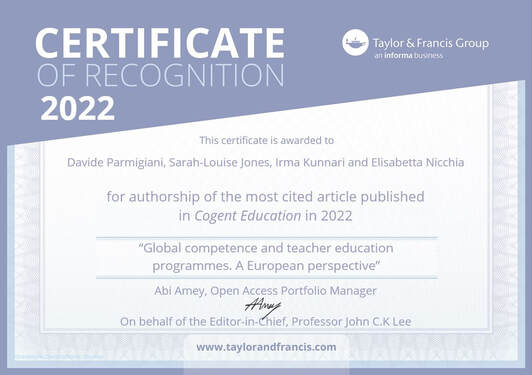
Most cited article in Cogent Education in 2022
|
We also have some quantitative data regarding specific learning outcomes. For example...
After running the series of workshop in IO2 we received the following feedback which is directly related to impact:
The group presentations were interesting to listen to - 100% (with 66.7% yes, 33.3% most of the time)
My group received useful feedback - 100% (with 83.3% yes, 16.7% most of the time)
I have renewed interest to carry on with my group's work - 100% (with 88.9% yes, 11.1% mostly)
I’ve learned from others during this experience - 100% (with 100% yes)
So far this has been a positive experience - 100% (with 88.9% yes, 11.1% mostly)
After running an LTTE in Belgium to train the wider partnership staff on IO3 Flexible CPD Training Programme, we ran a feedback survey and received the following feedback which is directly related to impact:
I received valuable feedback from others - 82.8% (with 53.9% strongly agreed, 28.9% agreed)
I feel confident to use these teaching materials with those I teach - 94.7% (with 57.9% strongly agreed, 36.8% agreed)
The content helped me understand how to develop global competence in myself - 100% (with 86.8% strongly agreed, 13.2 % agreed)
Qualitative Impact Data
There is a vast amount of impact data that is qualitative in nature and far too much to share, however please find below a sample form IO2, IO3 and then some general impact comments received after webinars and conferences.
Sample of quotes still to be added ...